The Covid-19 pandemic has changed the world. It changed how we run business, how we work, and how we do our everyday life. For most businesses, 2021 is definitely the year of transition.
Digital Transformation has been the primary focus and investing on ways to increase online presence is no longer an option but a must. According to Shopify, in mid 2020 worldwide e-commerce sales rose to $3.5 trillion US dollars, an uplift of 18% versus 2019. It is expected to double in 2023 when online sales growth is expected on food and beverage, retail, personal care, beauty and health.
To be successful in this new normal, organizations’ top priority is to improve digital presence by keeping their operation lean. The strategy is to find ways of doing more with less such as keeping your team small while achieving high results.
But how will you keep your digital marketing operation lean? How will you manage your resources more efficiently and make sure they spend most of their time on what matters?

Going through different platforms such as Google Analytics, CRM and emailing platforms to collect and transform raw data prior to processing and analysis can take anywhere between five hours to a whole week, depending on the data size and shape.
This article will share how to use Python to automate data extraction from Google Analytics and Mailchimp (the most common digital tools for analytics and email communication).
It will also cover how to automate file upload in Mailchimp with the use of APIs; and show the basic use of Pandas library for data reformatting, merging and visualization to find patterns and trends.
Step One – Google Analytics data extraction using Python
The complete guide of setting-up your Google Analytics data extraction using Python is found in this link (content creation still in development).
To automate your data extraction from Google Analytics through Python you need two things, (1) Google API service account private key and (2) your Google Analytics Property View ID.
Thanks to Tobias for creating this Python code
import pandas as pd
from apiclient.discovery import build
from oauth2client.service_account import ServiceAccountCredentials

SCOPES = ['https://www.googleapis.com/auth/analytics.readonly']
KEY_FILE_LOCATION = 'your-Google API-service-account-private-key'
VIEW_ID = 'property-view-id'

def initialize_analyticsreporting():
credentials = ServiceAccountCredentials.from_json_keyfile_name(
KEY_FILE_LOCATION, SCOPES)
analytics = build('analyticsreporting', 'v4', credentials=credentials)
return analytics

#Get one report page
def get_report(analytics, pageTokenVar):
return analytics.reports().batchGet(
body={
'reportRequests': [
{
'viewId': VIEW_ID,
'dateRanges': [{'startDate': '10daysAgo', 'endDate': 'yesterday'}],
'metrics': [{'expression': 'ga:pageviews'}],
'dimensions': [{'name': 'ga:date'},{'name': 'ga:dimensionUID'},{'name': 'ga:source'},{'name': 'ga:pagePath'},{'name': 'ga:deviceCategory'}],
'pageSize': 10000,
'pageToken': pageTokenVar,
'samplingLevel': 'LARGE'
}]
}
).execute()

def handle_report(analytics,pagetoken,rows):
response = get_report(analytics, pagetoken)

#Header, Dimentions Headers, Metric Headers
columnHeader = response.get("reports")[0].get('columnHeader', {})
dimensionHeaders = columnHeader.get('dimensions', [])
metricHeaders = columnHeader.get('metricHeader', {}).get('metricHeaderEntries', [])

#Pagination
pagetoken = response.get("reports")[0].get('nextPageToken', None)

#Rows
rowsNew = response.get("reports")[0].get('data', {}).get('rows', [])
rows = rows + rowsNew
print("len(rows): " + str(len(rows)))

#Recursivly query next page
if pagetoken != None:
return handle_report(analytics,pagetoken,rows)
else:
#nicer results
nicerows=[]
for row in rows:
dic={}
dimensions = row.get('dimensions', [])
dateRangeValues = row.get('metrics', [])

for header, dimension in zip(dimensionHeaders, dimensions):
dic[header] = dimension

for i, values in enumerate(dateRangeValues):
for metric, value in zip(metricHeaders, values.get('values')):
if ',' in value or ',' in value:
dic[metric.get('name')] = float(value)
else:
dic[metric.get('name')] = int(value)
nicerows.append(dic)
return nicerows

#Start
def main():
analytics = initialize_analyticsreporting()

global dfanalytics
dfanalytics = []

rows = []
rows = handle_report(analytics,'0',rows)

dfanalytics = pd.DataFrame(list(rows))

if __name__ == '__main__':
main()

Step Two – Mailchimp data extraction using Python
The complete guide of setting-up your Mailchimp data extraction using Python is found in this link (content creation still in development).
To automate your data extraction from Mailchimp through Python you need three things, (1) API Key (2) User ID and (3) List ID.
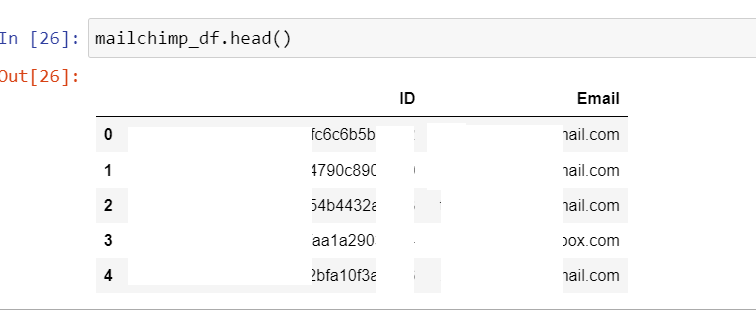
##open mailchimp data
from mailchimp3 import MailChimp

client = MailChimp(mc_api='mailchimp_API_and_server_ID_here', mc_user='user_name')

client.lists.members.all('members_ID', get_all=True, fields="members.email_address,members.id")

jason_file = client.lists.members.all('members_ID', get_all=True, fields="members.email_address,members.id")

##convert jason to dataframe
mailchimp_df = pd.DataFrame(jason_file)

##data cleansing
mailchimp_df["members"]=mailchimp_df["members"].apply(lambda x:str(x).replace(":"," "))
mailchimp_df["members"]=mailchimp_df["members"].apply(lambda x:str(x).replace("'"," "))
mailchimp_df["members"]=mailchimp_df["members"].apply(lambda x:str(x).replace(","," "))
mailchimp_df["members"]=mailchimp_df["members"].apply(lambda x:str(x).replace("{"," "))
mailchimp_df["members"]=mailchimp_df["members"].apply(lambda x:str(x).replace("}"," "))
mailchimp_df["members"]=mailchimp_df["members"].apply(lambda x:str(x).replace("id"," "))
mailchimp_df["members"]=mailchimp_df["members"].apply(lambda x:str(x).replace("email_address"," "))

##put field values into two columns
mailchimp_df[['ID','Email']] = mailchimp_df.members.str.split(expand=True)
##remove unwanted columns
mailchimp_df.drop(columns =["members","total_items"], inplace = True)

mailchimp_df.shape
Step Three – Merging all datasets into one data frame and find insights and patterns
The idea is to use the Python Pandas library to find patterns and similar behaviors between your members list. Once identified, we will put them together in the same groups or segments, and tailor our content to their unique needs and challenges.
Google Analytics data, Mailchimp Data and CRM are merged into one data frame to have a single view of the entire customer records and perform data analysis from there.


While there are more Segmentation Models you can use to group your customers together, the models applied to segment members in this example are Demographic Segmentation, Technographic Segmentation and Behavioral Segmentation.
| MODEL | HOW CUSTOMERS ARE SEGMENTED |
| Demographic Segmentation | Age, Gender, Status, Education, Income |
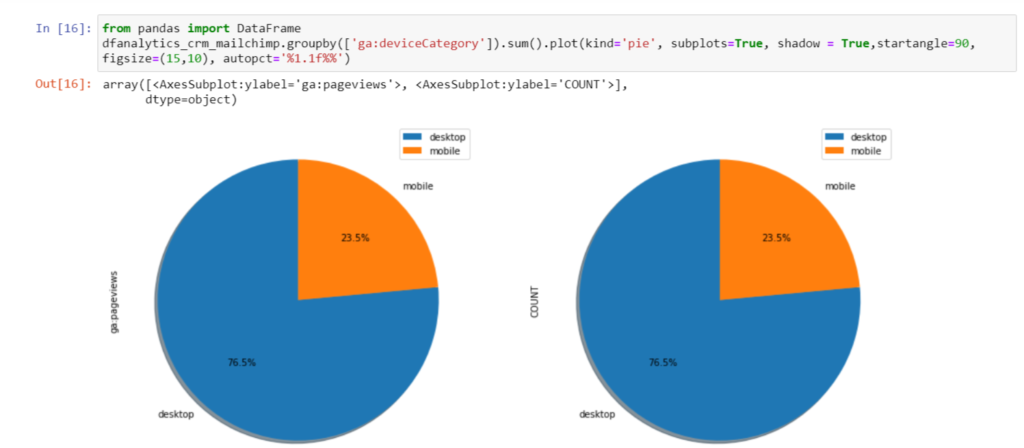
| Technographic Segmentation | Mobile and Desktop use |
| Behavioral Segmentation | Website actions, pageviews on specific pages, clicks, scrolling etc., |
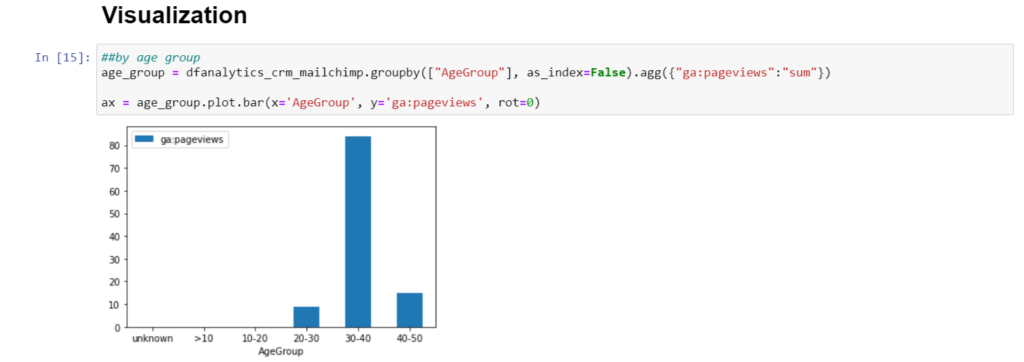
Patterns are identified through age group and website activities through browsed article types such as Digital Analytics, Digital Marketing and Leadership.
Three segments were created and named as DataDriven segment, Digital Leaders segment and Marketers segment.
Step Four – Updating members list in Mailchimp using Python
Using Mailchimp, the plan is to create targeted campaigns to resonate with and engage segments of customers. The expected outcome is to increase customer loyalty with personalized content and interactions.
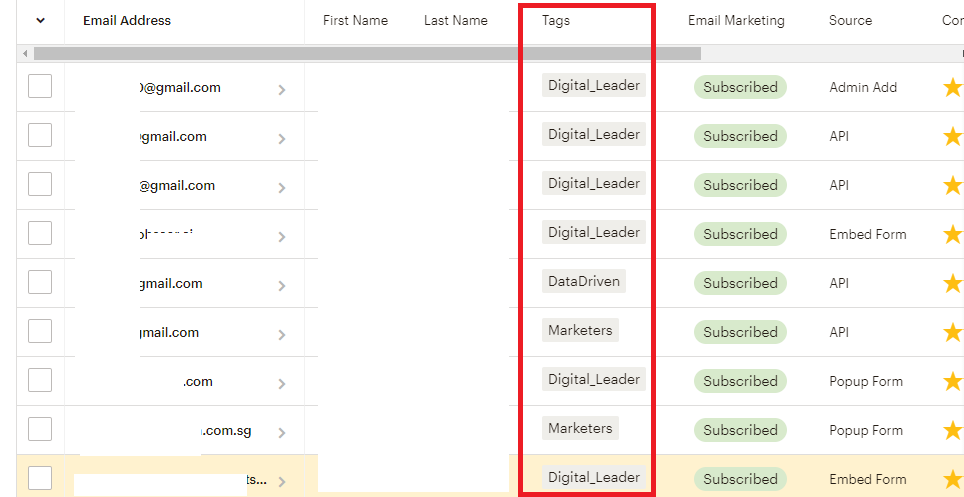
We will update our members record in Mailchimp by uploading the segment names identified with each member through the Tags field.
try:
client = MailchimpMarketing.Client()
client.set_config({
"api_key": "mailchimp_API_here",
"server": "your_server_ID_here"
})

response = client.lists.update_list_member_tags("list_id", "member_individual_id", {"tags": [{"name": "DataDriven", "status": "active"}]})
response = client.lists.update_list_member_tags("list_id", "member_individual_id", {"tags": [{"name": "Marketers", "status": "active"}]})
response = client.lists.update_list_member_tags("list_id", "member_individual_id", {"tags": [{"name": "Digital_Leader", "status": "active"}]})
response = client.lists.update_list_member_tags("list_id", "member_individual_id", {"tags": [{"name": "Digital_Leader", "status": "active"}]})
response = client.lists.update_list_member_tags("list_id", "member_individual_id", {"tags": [{"name": "Digital_Leader", "status": "active"}]})
response = client.lists.update_list_member_tags("list_id", "member_individual_id", {"tags": [{"name": "DataDriven", "status": "active"}]})
response = client.lists.update_list_member_tags("list_id", "member_individual_id", {"tags": [{"name": "Marketers", "status": "active"}]})
response = client.lists.update_list_member_tags("list_id", "member_individual_id", {"tags": [{"name": "Digital_Leader", "status": "active"}]})
print(response)
except ApiClientError as error:
print("Error: {}".format(error.text))
Members data are now updated in Mailchimp with Segment Names populated in Tags Field.
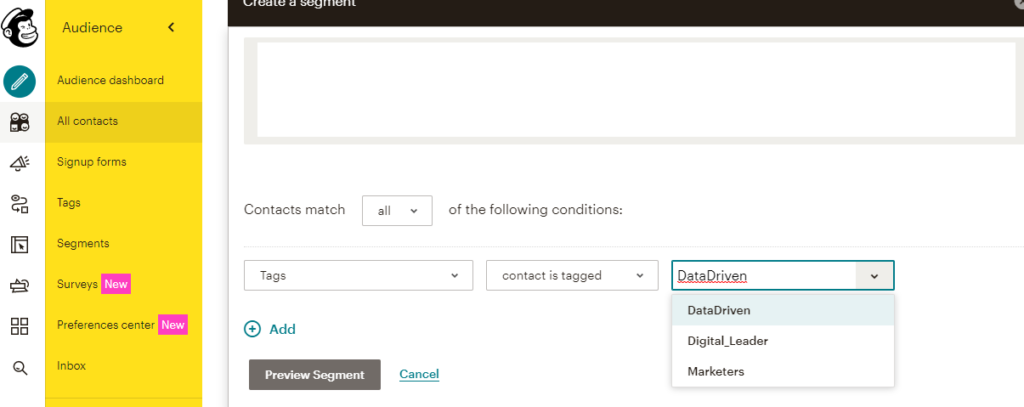
Using Mailchimp, you can start creating your segment according to a TAG assigned to each member and begin your email campaign personalization.
Digital Marketing with Python
Members tagged under DataDriven will receive blog engagement campaigns related to data modeling use cases, dashboarding creation or tracking tool how to’s topics.
Members tagged under Marketers will receive blog engagement campaigns related to digital marketing strategies, retention strategies or SEO topics.
Members tagged under Digital Leader will receive blog engagement campaigns related to thought leadership articles or data/digital transformation articles.
What is the Impact of this automation?
In general, depending on your familiarity and skillset, step one to step two will take you an hour or more to extract data depending on the data size and the shape. Applying above extraction will only take you about two minutes to extract and process the data using Python.
Time spent on data merging, cleansing, preparation and exploration can take days or weeks depending on the complexity, size and patterns you are looking for in the data.
However, as long as you understand your data frame and are familiar with the complexity of the fields and values within your data, you can create a Python script to automate and shorten the time spent on performing data cleasing, merging and exploration.
By using Python as your automation tool, you can free up your team’s time to spend on what really matters such as performing analysis, campaign optimization and decision making.
With data immediately extracted, cleansed, aggregated, processed and displayed, your team can efficiently provide data reports in a timely manner.
This kind of automation not just saves time and cost but also creates a positive impact on your employees who no longer need to manually prepare reports using large spreadsheets and copy pasting data.
Additionally, your team can respond to constant change with confidence while maintaining quality service level to provide a significant edge on the growing competition online.